BESA Connectivity 2.0 is now released. Experience the un-matched combination of state-of-the-art technology and superior ease-of-use, paired with top-of-the range visualization options! Applying these to your data will help you reveal the brain connectivity related to your experiment.
Highlights of the new version are:
- Batch processing for both time-frequency and connectivity workflows – analyze your complete subject set in one go, also for multiple conditions
- Multi-taper time-frequency analysis to enable smooth time-resolved Granger connectivity results
- New connectivity methods including weighted or unweighted Phase-Lag Index available with a single mouse click
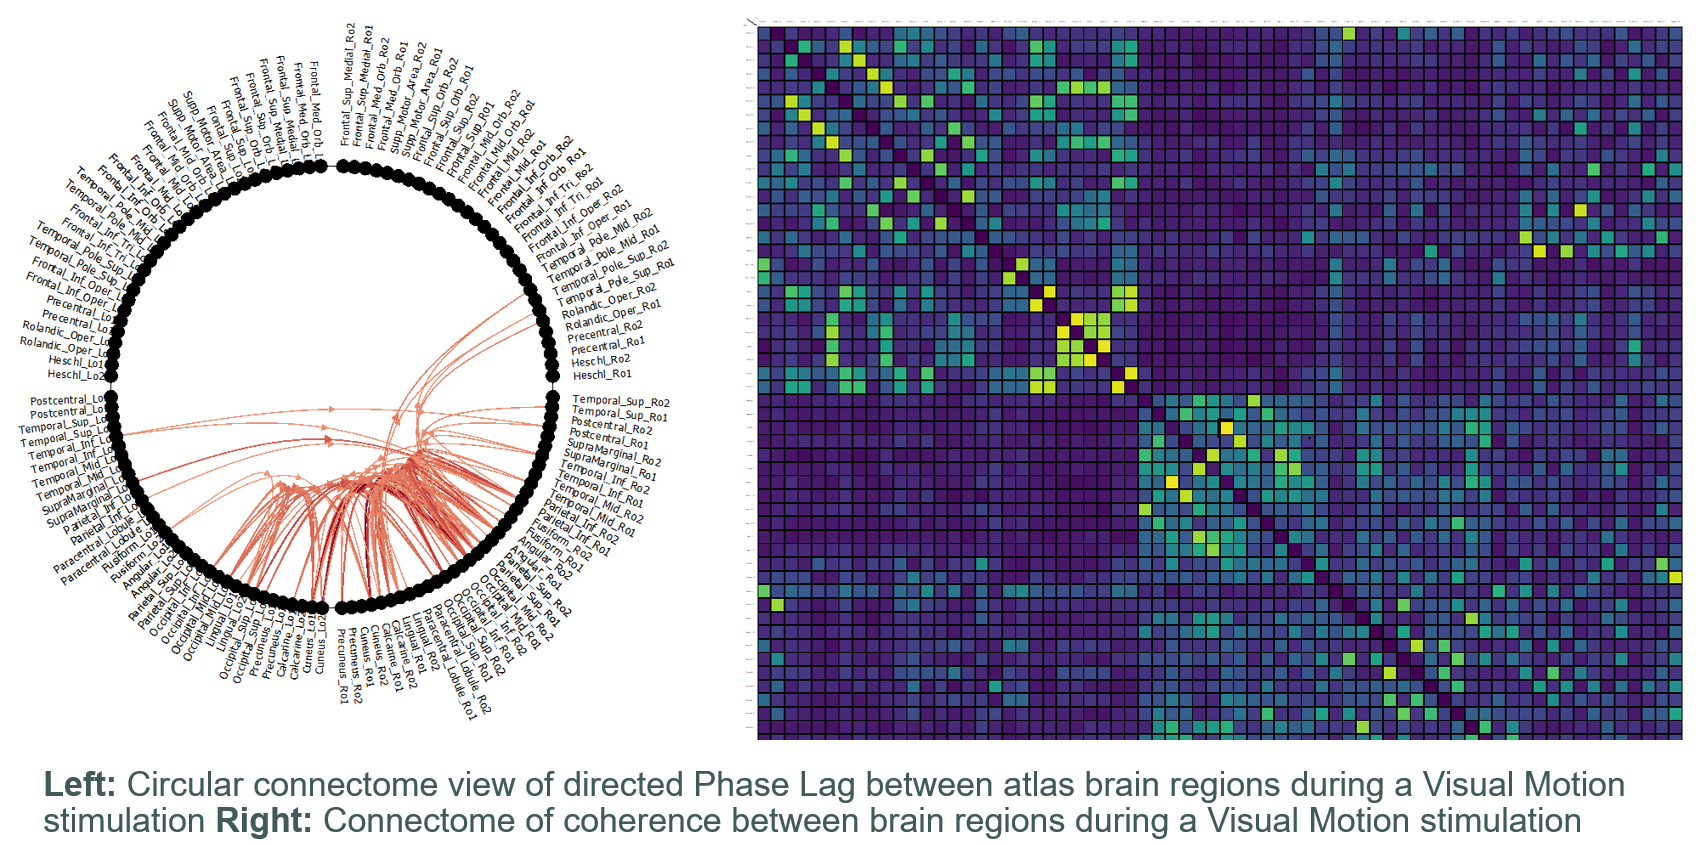
- Enhanced matrix view to show the complete connectome even for large number of sources at one glance, making it fully compatible with fMRI or fiber-tracking connectivity plots – with the added benefit of being frequency-specific; adaptable on the fly!
- Circular connectome view to show the complete connectome in one graphic overview
- Grand average visualization for time-frequency and connectivity data
- Direct batch export for your entire project to BESA Statistics
Note: This program is for research use only. In the European Union, the release is still pending.
Comments are closed.