This site presents the products of BESA GmbH, the leading innovators in digital EEG and MEG software for research and clinical applications.
- New online workshop scheduled
See our workshop post for more information
Optimal Visualization
Optimal Visualization
Significant data clusters are visualized optimally for each data type. It is possible to display several clusters or only one selected cluster at a time. The main window gives an overview over all channels / sources / voxels. Significant time-periods are optionally highlighted.
Visualization of Significant Data Clusters
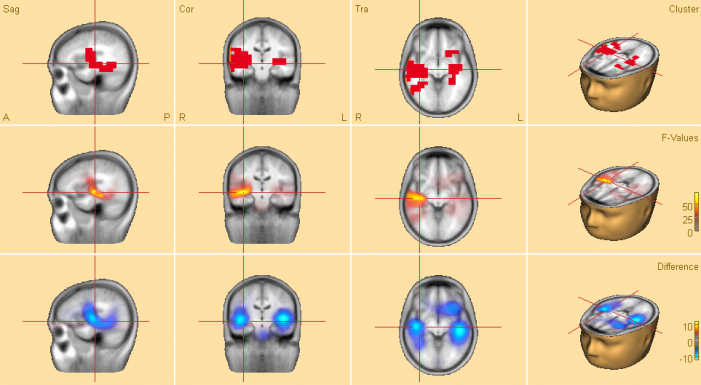
- Statistical values can be directly used in scientific reports without further analysis
- All statistical results can be exported
- Detailed cluster information per person can be exported
- All images can be saved as vector graphics (eps)
Mapping of Time-Frequency Clusters
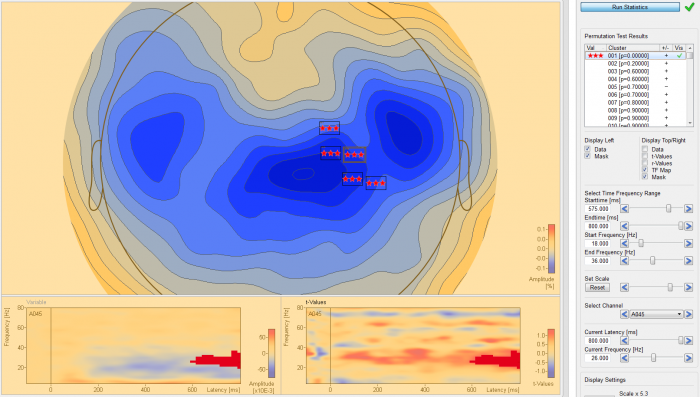
- Mapping range automatically adjusted to cluster boundaries
- Channels involved in cluster of interest are highlighted
Recent Comments