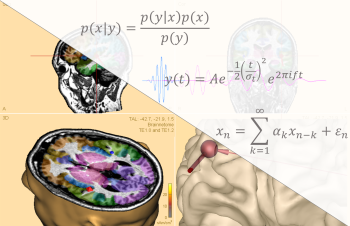
BESA Research 7.0 sets new standards in several aspects of neurophysiological data analysis:
| Welcome to the most streamlined and comprehensive analysis package available for state-of-the-art research using human EEG and MEG data! Particular highlights of the new feature list include: |  |
Combined EEG-fMRI data collection:
- Correct your fMRI artifacts directly in the BESA Research review window with a few mouse clicks! Choose one of three proven methods for best correction results, and see the effects on the correction matrix directly visualized.
- Read your fMRI data directly into BESA Research and compare to your EEG source imaging results; or use the fMRI clusters as constraints for dipole source analysis.
Time-domain beamformer:
- Calculate a time-domain beamformer using one of several state-of-the-art methods. Reconstruct beamformer activation time courses of any brain voxel. Conveniently toggle through beamformer maxima to create these reconstructions with few mouse clicks.
- Create source montages using the beamformer spatial filter and apply to raw data analysis including connectivity analysis!
Bayesian source imaging:
- Experience source imaging using a completely new class of methods! Introducing Sequential Semi-Analytic Monte-Carlo Estimation (SESAME) of sources: This automated method explores the probabilities of solutions with various numbers of dipoles, and presents the user with the most likely solution.
- Use the SESAME solution as a focal source image, or create dipole or regional source solutions from the local maxima.
Brain atlases:
- Check the anatomical or functional brain regions of your source imaging or dipole fitting results, or seed sources from known locations in the brain atlas.
- Choose between several state-of-the-art atlases including AAL, Brainnetome, and of course Brodmann.
- Visualize source imaging results together with atlas images with BESA’s innovative contour display mode.
Brand-new connectivity module:
- BESA Connectivity is the brand-new tool for analyzing the connectivity between your source or sensor data. Integrated seamlessly with BESA Research, it offers streamlined work flows to take you through time-frequency analysis using wavelets or complex demodulation, and the analysis of connectivity between source channels, or sensor level data.
- Use the latest connectivity methods including Granger Causality, Partial Directed Coherence, and others.
- Visualize data in clear 2D and 3D result plots and create publication images or videos.
- Export results for further analysis in e.g. BESA Statistics.
- BESA Connectivity is included in the BESA Research Complete program package without extra charge!
On top of all these, there will be several other new features available. And do we need to mention that all these features are provided with the usual BESA approach of clear and concise user interface, offering established defaults to work through your analyses with few mouse clicks, as well as highly user-controllable advanced settings?
Order now to benefit from reduced prices and the two-for-one upgrade policy until the end of 2017 (see Special early bird BESA Research upgrade offer)!
Please e-mail sales@besa.de for more information and a quotation.

Comments are closed.